The Geography of Inflation: Mapping the Hyper-Local Volatility of US Gas Prices
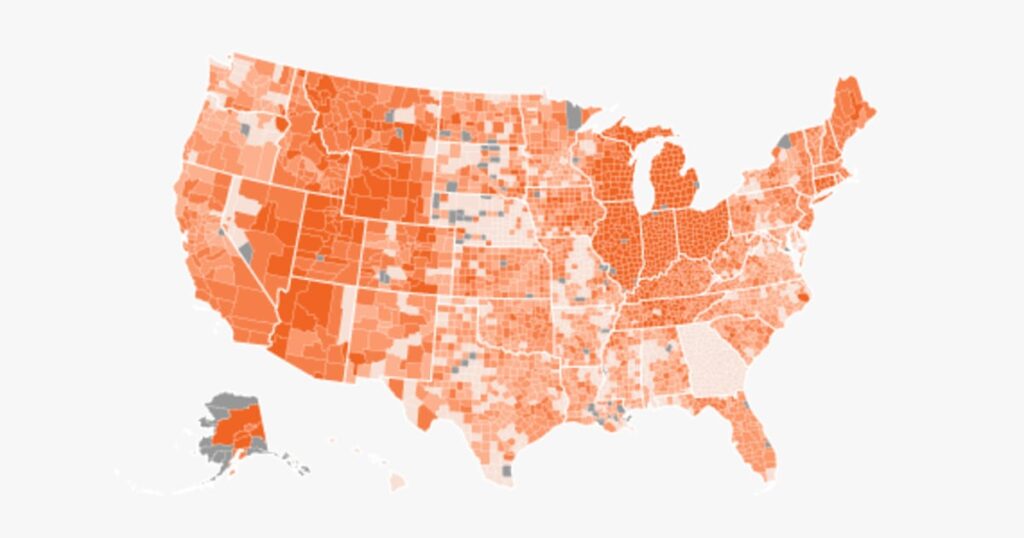
Table of Contents
The Granular Reality of the Pump
While national averages provide a broad sense of economic health, they often mask a chaotic reality at the local level. Recent data analysis of average gas prices from AAA reveals that fuel inflation is not a uniform wave hitting the United States, but rather a series of erratic spikes depending on specific county lines and state-level fiscal interventions.
The disparity is most evident in the extreme outliers. In Kingsbury County, South Dakota, the cost of a gallon of gas reached $4.57 as of Thursday—a staggering 87% increase compared to prices recorded at the onset of the conflict in Iran. In this specific locale, the price surged by $2.13 per gallon, creating a localized cost-of-living crisis that deviates sharply from the national trend.
Conversely, the experience in Whitley County, Indiana, tells a different story. Despite being in a region often susceptible to Midwest pricing swings, residents there saw an increase of only 73 cents per gallon. This gap underscores a critical point for economists: the ‘national average’ is often a mathematical fiction that fails to represent the actual financial pressure on the average consumer.
State Interventions and Tax Shielding
The variance isn’t just a result of supply chain logistics or refinery proximity; it is heavily influenced by government policy. Georgia serves as a primary example of how state-level maneuvers can dampen the impact of global energy shocks. By suspending its 33-cent-per-gallon state gas tax in mid-March, Georgia managed to keep its average price increase to $1.18—the second-lowest state-level rise in the country.
On the opposite end of the spectrum is Illinois, where the average price climbed by $1.84 per gallon, marking the steepest state-level increase in the U.S. This divergence highlights the tension between state revenue needs and the political pressure to provide immediate relief to voters at the pump.
Data Patterns and Regional Clusters
The broader data set reveals a distinct clustering of price volatility. As of May 5, the national average increase across counties sat at $1.47 per gallon. However, a deep dive into the geography shows a concentrated ‘heat map’ of inflation. Approximately 100 counties, primarily clustered in Indiana and Ohio, have experienced price hikes exceeding $2 per gallon.
Meanwhile, a small group of roughly a dozen counties—mostly located in Georgia and Nebraska—have managed to keep increases below the $1 threshold. These regional anomalies suggest that local distribution networks and regional storage capacities may be playing a larger role in price stability than previously understood.
The Political Dimension of Pricing
These numbers are not just economic data points; they are political liabilities. Polling indicates that energy costs and general economic instability have become primary concerns for voters heading into the midterm elections. With nearly two-thirds of Americans identifying gas prices as a significant problem, the hyper-local nature of these spikes creates a fragmented political landscape where a voter in Kingsbury County is experiencing a fundamentally different economic reality than a voter in Whitley County.
As digital tracking tools and interactive maps become more sophisticated, the ability to visualize these disparities in real-time is shifting the conversation from national trends to regional accountability. The reliance on AAA data and interactive visualization allows for a level of transparency that traditional reporting often misses, exposing the true volatility of the American energy market.