The Geography of Inflation: How Local Infrastructure and Tax Policy Are Driving Wildly Divergent Gas Prices
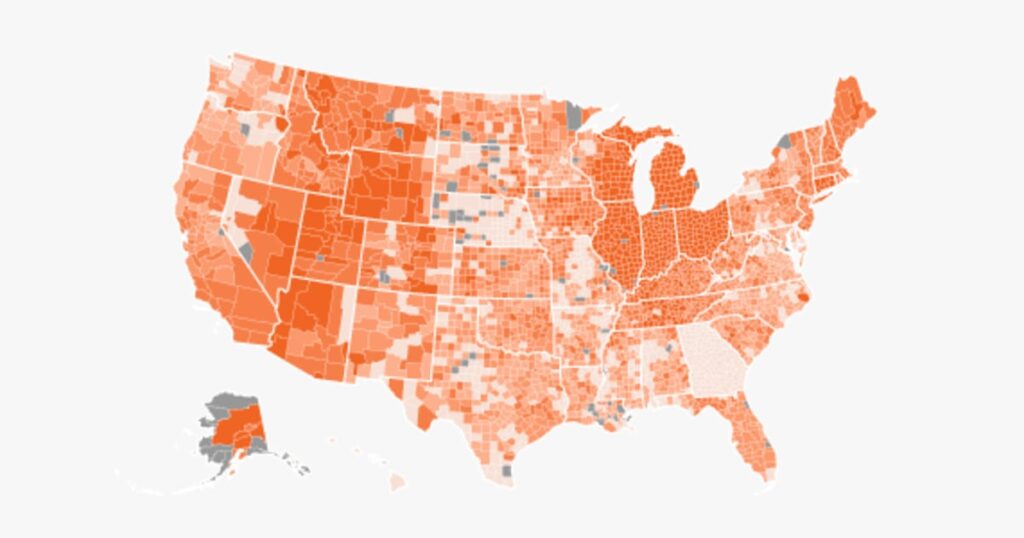
Table of Contents
The Localized Shock of Fuel Inflation
While national headlines often treat gas prices as a monolith, the reality on the ground is a fragmented map of economic volatility. A granular analysis of average fuel data from AAA reveals that the financial burden of the current energy crisis is not being shared equally. In some pockets of the country, drivers are facing price hikes that dwarf the national average, while other regions have remained relatively insulated.
The most extreme example of this disparity is found in Kingsbury County, South Dakota. As of Thursday, the average price there hit $4.57 per gallon—a staggering 87% increase since the onset of the conflict in Ukraine. To put that in perspective, Kingsbury County saw a climb of $2.13 per gallon, a figure that feels disconnected from the experience of drivers just a few states over.
Contrast this with Whitley County, Indiana, where the population of 34,000 has seen a far more modest increase of only 73 cents. This gap highlights a critical truth about fuel logistics: the cost at the pump is less about global crude markets and more about local distribution networks, regional refinery capacity, and state-level fiscal policy.
Tax Intervention and State-Level Buffers
State governments have attempted to mitigate these shocks with varying degrees of success. The data shows a clear correlation between tax suspensions and price stability. Georgia, for instance, recorded the second-lowest state-level increase in the nation, with prices rising by $1.18 per gallon. This relative stability can be traced back to a mid-March decision by Georgia officials to suspend the state’s 33-cent per gallon gas tax.
Conversely, Illinois has become a flashpoint for fuel inflation, seeing the largest state-level increase in the U.S. at $1.84 per gallon. The divergence between Georgia and Illinois underscores how government intervention—or the lack thereof—acts as a primary lever in determining whether a consumer feels a moderate pinch or a financial crisis.
Data Trends: The ‘Hundred-County’ Spike
When zooming out to a national level, the average county has seen an increase of $1.47 per gallon as of May 5. However, the average is misleading. The data reveals a clustering effect where roughly 100 counties, primarily concentrated in Ohio and Indiana, have experienced price surges exceeding $2 per gallon.
On the opposite end of the spectrum, a small group of roughly a dozen counties, mostly located in Nebraska and Georgia, have seen increases of less than $1 per gallon. This creates a binary experience for the American commuter; depending on which side of a state line they reside, the impact on their monthly disposable income varies by hundreds of dollars.
The Political Stakes of the Pump
These localized spikes are doing more than just straining budgets; they are fueling political volatility heading into the midterm elections. Polling consistently indicates that the economy and fuel costs are top-tier issues for voters. With nearly two-thirds of Americans citing gas prices as a significant problem, the regional disparities identified in the AAA data suggest that voter frustration will be most acute in those 100 high-surge counties.
As the digital mapping of these prices becomes more sophisticated, it is becoming clear that the ‘national average’ is a failing metric for understanding the actual economic pressure on the American public. The story isn’t that gas is expensive—it’s that for some, it is prohibitively so, while for others, the increase is merely an inconvenience.