The Gasoline Gap: Data Reveals Extreme Regional Divergence in US Fuel Pricing
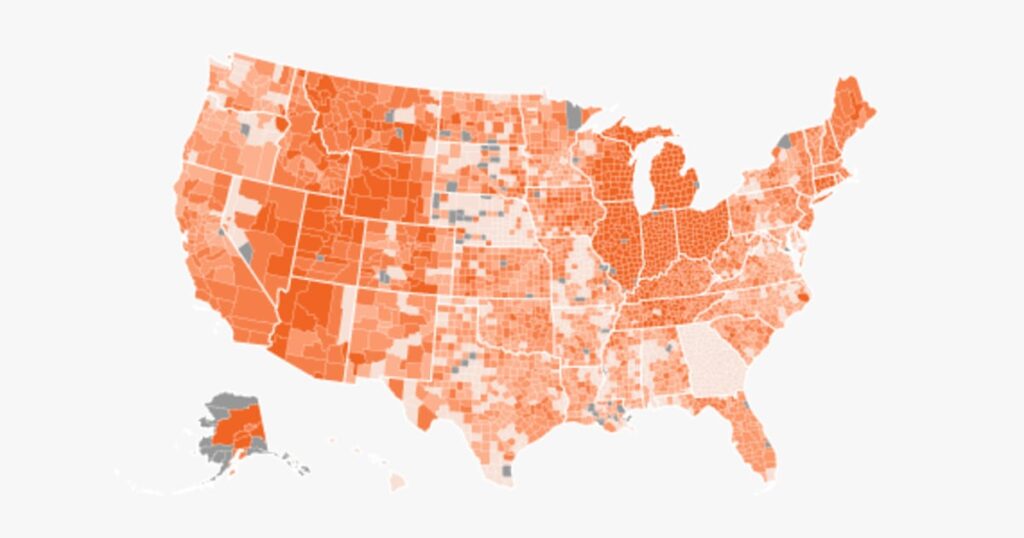
Table of Contents
The Geography of Inflation
While the national conversation around fuel costs often focuses on a single, homogenized average, the actual experience of American drivers is fractured by geography. New analysis of average gas price data from AAA reveals a staggering disparity in how inflation is hitting different counties, turning the act of filling a tank into a high-stakes lottery based on zip code.
In some regions, the surge is nearly catastrophic. In northern Douglas County, Illinois, and Kingsbury County, South Dakota, motorists faced average prices as high as $4.87 per gallon as of recent reporting. For these residents, the cost of fuel has spiked by as much as 87% since the onset of the conflict in Iran—a volatility that far outpaces the national average and creates a localized economic shock.
Conversely, the data highlights pockets of relative stability. In Scott County, Indiana, where the population sits around 24,384, the price increase was a comparatively modest 77 cents. This gap—where one driver pays over two dollars more per gallon than another for the same commodity—points to a complex intersection of logistics, local competition, and state-level policy interventions.
Policy Levers and State Disparities
The divergence isn’t just happening at the county level; it’s deeply embedded in state governance. Georgia serves as a primary case study in the impact of tax intervention. The state’s average gas prices rose by only $1.25 per gallon, marking one of the lowest state-level increases in the country. This was not an accident of the market, but a direct result of Georgia’s decision to suspend its 33-cent per gallon state gas tax in mid-March.
Illinois presents the opposite trajectory. Without similar aggressive tax suspensions or different logistical advantages, Illinois saw an average price jump of $2.03 per gallon, the steepest increase recorded in the U.S. This delta suggests that while global crude oil prices set the floor for fuel costs, state treasury departments effectively control the ceiling.
The Data Behind the Pump
When aggregating the numbers, the average county-level increase stands at $1.47 per gallon. However, the “average” obscures the extremes. A cluster of roughly 100 counties, predominantly across Ohio and Indiana, have seen increases exceeding $2 per gallon. In contrast, a small group of just over a dozen counties—mostly concentrated in Nebraska and Georgia—have managed to keep increases under the one-dollar mark.
These anomalies are often driven by the “last mile” of fuel delivery. The cost of transporting fuel via pipeline or truck to remote counties in the Midwest can exacerbate price hikes when wholesale costs rise, as distributors bake higher transport risks into the retail price.
Economic Anxiety and Political Stakes
The volatility of these numbers is more than just a data point for economists; it is a primary driver of voter sentiment. Polling consistently indicates that the economy and fuel costs are top-of-mind for Americans heading into midterm elections. Recent data suggests that nearly two-thirds of the population view gas prices as a significant problem, reflecting a broader anxiety about the cost of living that transcends political affiliation.
As digital mapping and real-time data tracking become more integrated into the consumer experience, the visibility of these disparities is increasing. Drivers are no longer just comparing prices between two stations on the same block, but are seeing the systemic inequalities of fuel distribution across state lines.