The Gas Price Gap: Data Reveals Extreme Regional Volatility in US Fuel Costs
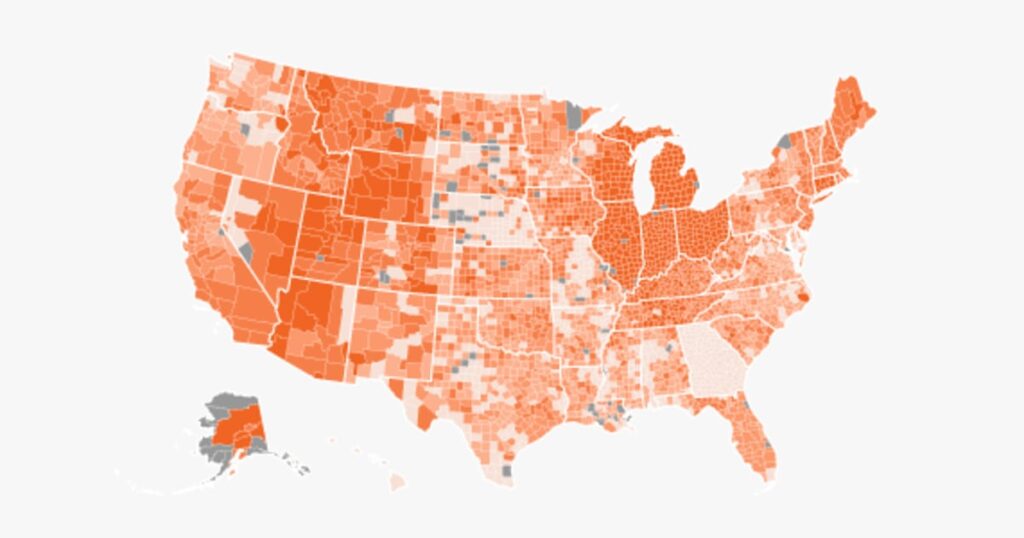
Table of Contents
Geography as a Price Determinant
While the national conversation around fuel costs often focuses on a single average, a granular analysis of AAA data reveals a far more chaotic reality. The cost of filling up a tank is no longer just a matter of global crude markets, but of precise geography. In some pockets of the Midwest, drivers are facing price shocks that dwarf the national average, while other regions remain remarkably insulated.
The most extreme examples of this volatility are appearing in northern Douglas County, Illinois, and Kingsbury County, South Dakota. In these areas, the average gallon of gas reached as high as $4.87 recently—a staggering 87% increase compared to prices recorded at the onset of the conflict in Iran. For residents in these counties, the price hike isn’t just a marginal increase; it is a systemic shock to their weekly household budgets.
Contrast this with Scott County, Indiana. Despite being in the same general region of the country, prices there climbed by only 77 cents per gallon over the same period. This discrepancy highlights a growing gap in how energy costs are distributed across the U.S., suggesting that local supply chains, state-level tax interventions, and regional distribution bottlenecks are playing a larger role than global pricing trends alone.
The Role of State Policy in Price Mitigation
The data suggests that government intervention can create a measurable buffer against global price volatility. Georgia serves as a primary case study in this regard. While many states watched prices climb unchecked, Georgia suspended its 33-cent-per-gallon state gas tax in mid-March. The results were immediate and visible in the data: average gas prices in Georgia rose by only $1.25 per gallon, marking the second-lowest state-level increase in the entire nation.
Illinois, conversely, represents the opposite end of the spectrum. With an average price increase of $2.03 per gallon, it holds the title for the largest state-level surge in the U.S. This divergence underscores how state-level fiscal policy can either amplify or dampen the effects of global energy crises for the end consumer.
Mapping the Economic Friction
Across the country, the average county has seen an increase of $1.47 per gallon as of May 5. However, averages often mask the most critical data points. Approximately 100 counties, concentrated heavily in Ohio and Indiana, have seen increases exceeding $2 per gallon. These “hot zones” create localized economic friction, where the cost of commuting and transporting goods rises sharply, potentially triggering secondary inflation in local food and service prices.
On the flip side, a small cluster of roughly a dozen counties—primarily in Nebraska and Georgia—have seen increases of less than $1 per gallon. This suggests that while the “energy crisis” is a national headline, the actual economic burden is being distributed unevenly across the map.
Political Stakes and Consumer Sentiment
This data arrives at a critical juncture for U.S. policymakers. Polling consistently indicates that fuel costs and general economic stability are among the top priorities for voters heading into the midterm elections. According to recent survey data, nearly two-thirds of Americans identify gas prices as a primary concern.
The ability to track these prices in real-time via interactive mapping and data analysis has shifted the narrative from a general complaint about “high prices” to a specific critique of regional failures and policy successes. As these data sets continue to update daily, the pressure on state legislatures to mimic Georgia’s tax suspension may increase, especially in the high-volatility corridors of the Midwest.