The Gas Price Gap: How Regional Infrastructure and Tax Policy Are Creating Massive Cost Disparities
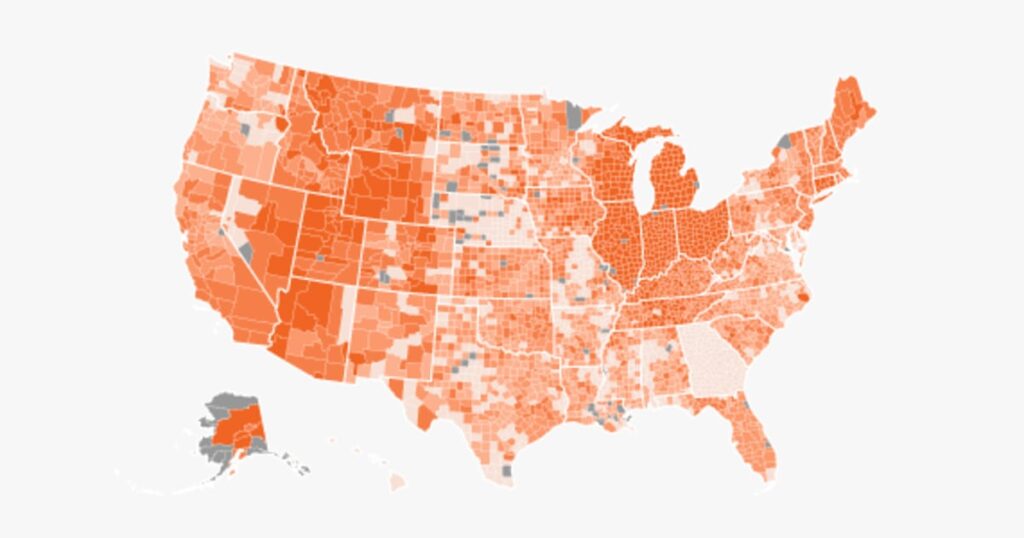
Table of Contents
The Geography of Inflation
On the surface, the surge in fuel costs across the United States feels like a monolithic experience. But a deeper dive into the data reveals a fragmented landscape where your zip code determines whether you’re facing a manageable price hike or a financial crisis. In northern Douglas County, Illinois, and Kingsbury County, South Dakota, residents are grappling with averages as high as $4.87 per gallon—a staggering 87% increase since the onset of geopolitical tensions in the Middle East.
This volatility isn’t uniform. While some drivers are seeing their costs double, others are experiencing a far more muted ascent. In Scott County, Indiana, for instance, the average price increase sat at just 77 cents per gallon. This stark contrast suggests that the national average is a misleading metric, masking a complex interplay of local supply chains, regional refinery capacity, and state-level fiscal policy.
The Policy Lever: Tax Suspensions and State Intervention
One of the most visible drivers of these disparities is the aggressive use of state tax levers. Georgia provides a prime example of a targeted policy intervention. By suspending its 33-cent-per-gallon state gas tax in mid-March, the state effectively cushioned the blow for its residents. Consequently, Georgia saw one of the lowest state-level increases in the country, with averages rising by only $1.25 per gallon.
Contrast this with Illinois, which has seen the largest state-level increase in the U.S., with prices climbing by an average of $2.03 per gallon. The gap between Georgia and Illinois isn’t just a matter of market forces; it is a reflection of how different state governments choose to interact with the energy market. When a state chooses not to alleviate the tax burden, the consumer absorbs the full weight of global crude volatility.
Data Anomalies in the Midwest
The most extreme outliers are concentrated in the Midwest, particularly across Indiana and Ohio. Analysis of AAA data shows that roughly 100 counties in these states have seen price spikes exceeding $2 per gallon. These “hot spots” often correlate with regions that have limited access to diverse pipeline networks or are heavily dependent on a few specific refineries. When a local refinery goes offline or a regional distribution hub hits capacity, the localized price spike occurs independently of the national trend.
On the opposite end of the spectrum, a small cluster of counties in Georgia and Nebraska have managed to keep increases below the $1 per gallon threshold. This suggests a high degree of regional resilience, likely bolstered by more efficient logistics or a higher concentration of independent distributors competing for market share.
The Political Economy of the Pump
These pricing disparities are more than just an economic curiosity; they are becoming central to the political narrative leading into the midterm elections. Polling data indicates that inflation and energy costs consistently rank among the top concerns for voters. For nearly two-thirds of Americans, the cost of fuel is no longer a seasonal inconvenience but a primary financial stressor.
As the cost of living continues to fluctuate, the reliance on real-time data tracking—such as the mapping tools developed by NBC News and AAA—has become essential for consumers. The ability to visualize these spikes at a county level exposes the reality that the “national average” is often a fiction, providing little utility to the driver in a high-cost zone like Kingsbury County.