The Geography of Inflation: Why Gas Price Surges Are Hitting U.S. Counties Unevenly
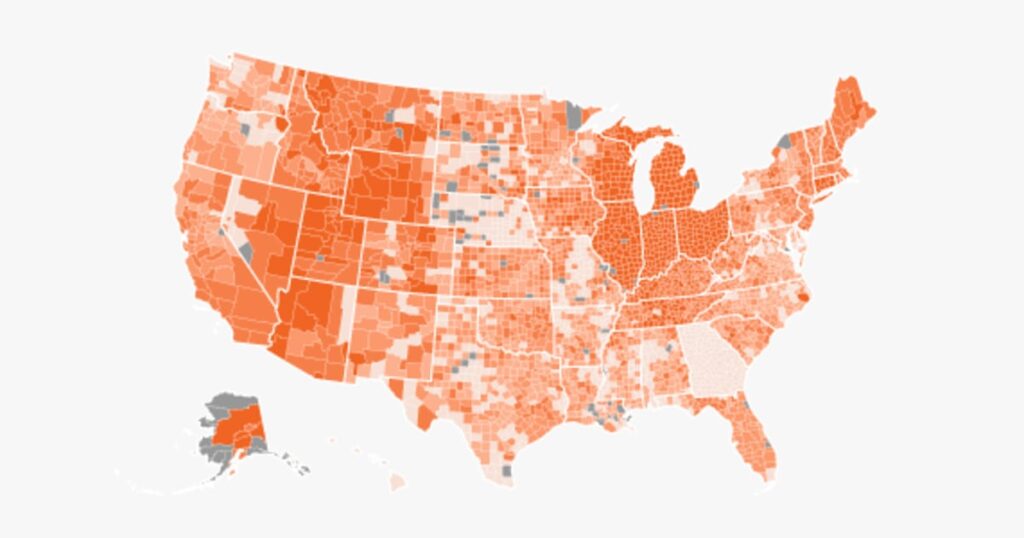
Table of Contents
The Localized Shock of Fuel Inflation
While the national conversation around fuel costs tends to focus on broad averages, the actual experience of the American consumer is fragmented by geography. A granular analysis of average gas price data from AAA reveals that the “national average” is often a mathematical fiction, masking extreme volatility that varies not just by state, but by county line.
The disparity is most evident when comparing the current peaks to the baseline established at the onset of the conflict in Iran. In Kingsbury County, South Dakota, the surge has been staggering. As of Thursday, prices hit an average of $4.57 per gallon—a massive 87% increase from the starting period. For residents of Kingsbury, the cost of a full tank has essentially shifted from a routine expense to a significant financial burden, with prices climbing $2.13 per gallon.
Contrast this with Whitley County, Indiana. Despite being in a region often associated with industrial logistics, the increase there was far more muted, rising only 73 cents per gallon. This suggests that local supply chain efficiencies, storage capacity, and regional competition can create “price islands” where consumers are shielded from the worst of the global shock.
Tax Policy as a Price Lever
State-level intervention has played a pivotal role in shaping these numbers. The divergence between Illinois and Georgia serves as a primary case study in how fiscal policy directly impacts the pump. Illinois has seen the largest state-level increase in the U.S., with averages climbing $1.84 per gallon.
Georgia, conversely, has seen one of the lowest increases in the nation, rising by $1.18 per gallon. This is not a coincidence of geography, but a result of direct government action; in mid-March, Georgia suspended its 33-cent-per-gallon state gas tax. This move effectively lowered the ceiling for consumers, demonstrating that while global crude prices are set on the international market, the final cost is heavily influenced by state capitals.
Mapping the Volatility
The data indicates a broader trend of uneven distribution. As of May 5, the average county-level increase sat at $1.47 per gallon. However, the distribution is skewed. Roughly 100 counties—clustered largely in Ohio and Indiana—have experienced price hikes exceeding $2.00 per gallon.
On the opposite end of the spectrum, a small group of counties, primarily in Nebraska and Georgia, have seen increases of less than $1.00. This suggests that the “energy crisis” is not being felt uniformly across the Midwest and South, but is instead hitting specific corridors harder based on refining capacity and distribution bottlenecks.
The Political Stakes of the Pump
These numbers are more than just economic data points; they are primary drivers of voter sentiment. Recent polling confirms that inflation and the cost of living are top-tier issues heading into the midterm elections, with nearly two-thirds of Americans citing gas prices as a significant problem.
When a voter in Kingsbury County sees an 87% increase while a voter in another region sees a fractional rise, the political interpretation of economic management changes. The volatility of the pump acts as a daily, visible barometer of economic instability, making high-resolution data—like county-level tracking—essential for understanding the current American social and political landscape.