The Geography of Inflation: How Localized Fuel Shocks are Redrawing the Economic Map
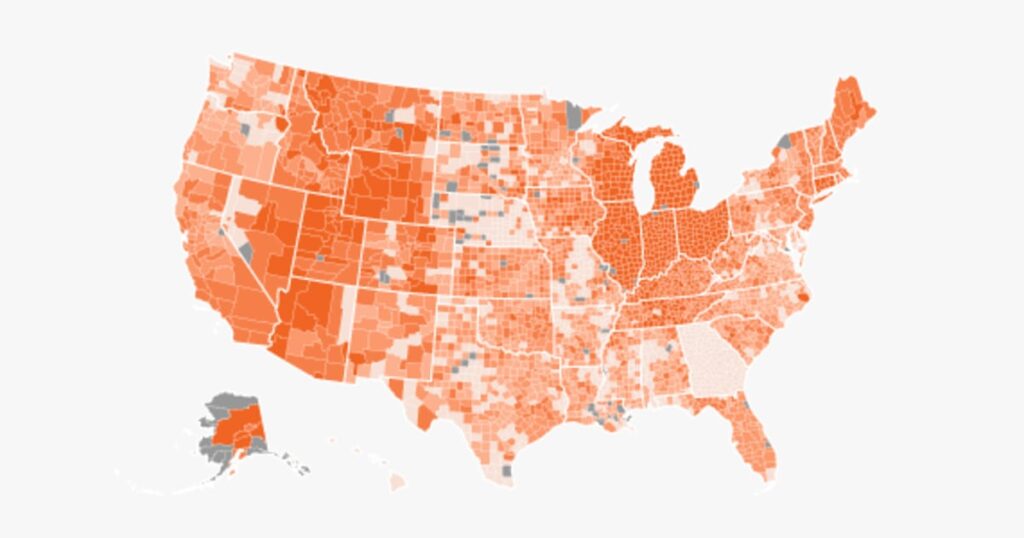
Table of Contents
A Tale of Two Gallons: The Stark Divide in Regional Fuel Costs
While national averages provide a convenient snapshot of economic health, they often mask a volatile reality happening at the county level. For a driver in Kingsbury County, South Dakota, the surge in fuel costs isn’t just a line item in a budget—it is a systemic shock. As of Thursday, the average gallon of gas in Kingsbury County hit $4.57, representing a staggering 87% increase since the onset of the conflict in Iran. To put that in perspective, the price per gallon in that single county climbed by $2.13.
Contrast that with Whitley County, Indiana. Despite facing the same global crude oil benchmarks, residents there saw a more modest increase of 73 cents. This disparity reveals that while global events trigger the initial price hike, local logistics, state taxation, and regional competition determine who bears the brunt of the inflation.
The Policy Lever: How State Taxes Alter the Curve
The data highlights a critical intersection between geopolitics and local governance. State-level interventions are creating visible “price islands” across the U.S. Georgia serves as a primary example of policy-driven mitigation. By suspending its 33-cent-per-gallon state gas tax in mid-March, Georgia managed to keep its average price increase to $1.18 per gallon—the second-lowest state-level increase in the country.
Illinois, conversely, tells a different story. Without similar aggressive tax suspensions, Illinois recorded the largest state-level increase in the nation, with averages climbing by $1.84 per gallon. This suggests that the “sticker shock” felt by consumers is as much a result of legislative decisions as it is of OPEC+ quotas or supply chain bottlenecks.
Mapping the Volatility
An analysis of AAA data paints a picture of extreme regional fragmentation. While the national average increase across counties stands at $1.47 per gallon, the distribution is far from uniform. Roughly 100 counties, concentrated heavily in Ohio and Indiana, have experienced surges exceeding $2 per gallon. These clusters likely reflect regional supply constraints or a lack of competitive retail density that usually keeps prices in check.
On the opposite end of the spectrum, a small pocket of about a dozen counties—primarily in Nebraska and Georgia—have managed to keep increases below the $1 mark. This divide creates a fragmented economic landscape where the cost of commuting or transporting goods varies wildly across a few dozen miles of a state border.
The Political Dimension of the Pump
These localized spikes are more than just a data point for economists; they are becoming central to the political discourse. Polling indicates that fuel costs and broader economic instability are among the top concerns for voters heading into the midterm elections. With nearly two-thirds of Americans citing gas prices as a primary problem, the granular reality of these increases—where one county is paying double what another is—adds a layer of regional frustration that national averages fail to capture.
As the global energy market remains tethered to geopolitical instability, the reliance on real-time, county-level tracking becomes essential. The ability to visualize these trends allows for a better understanding of where the supply chain is breaking and where policy interventions are actually working.