The Geography of Inflation: Why Gas Price Spikes Are Hitting Some U.S. Counties Harder Than Others
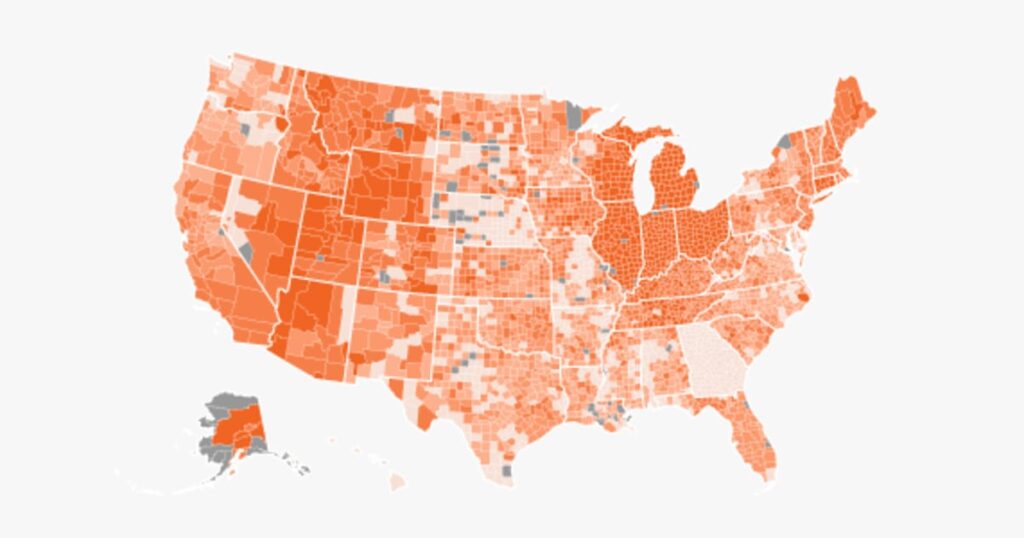
Table of Contents
The Hyper-Local Reality of Fuel Inflation
While national averages often paint a monolithic picture of economic strain, the actual cost of filling up a tank has become a study in regional volatility. According to an analysis of average gas price data from AAA, the surge in fuel costs is not being distributed evenly across the American landscape. Instead, a fragmented map of price hikes has emerged, where the difference between two neighboring counties can be measured in dollars rather than cents.
The most acute spikes are currently concentrated in the Midwest. In northern Douglas County, Illinois, and Kingsbury County, South Dakota, drivers faced average prices as high as $4.87 per gallon as of Sunday. In these specific locales, prices have climbed by as much as 87% compared to the baseline established at the onset of the conflict in Iran—a surge that far outpaces the national trend.
The Data Divide: From Illinois to Georgia
The disparity in these increases highlights how local logistics and state-level policy interventions create vastly different economic realities for consumers. For instance, while Douglas and Kingsbury counties saw increases of $2.12 per gallon, residents of Scott County, Indiana—a community of roughly 24,384 people—experienced a much more modest rise of 77 cents.
State-level policy has played a pivotal role in buffering these shocks for some. Georgia stands as a primary example; the state average increased by $1.25 per gallon, marking it as the second-lowest state-level increase in the country. This stability is not accidental. In mid-March, Georgia officials suspended the state’s 33-cent-per-gallon gas tax, providing a direct fiscal offset to consumers at the pump.
Conversely, Illinois has become the epicenter of the surge, recording the largest state-level increase in the U.S., with average prices climbing $2.03 per gallon. This suggests that without aggressive tax intervention or favorable regional refinery access, consumers are fully exposed to the volatility of the global crude market.
Mapping the Surge
As of May 5, the national average increase across counties stands at $1.47 per gallon. However, the distribution is skewed. Approximately 100 counties—clustered predominantly in Ohio and Indiana—have seen prices jump by $2 per gallon or more. On the opposite end of the spectrum, a small cluster of about a dozen counties, mostly located in Nebraska and Georgia, have seen increases of less than $1 per gallon.
This granular volatility is more than just a statistical curiosity; it is a significant political and social pressure point. Recent polling indicates that the cost of living and fuel prices have become primary concerns for voters heading into the midterm elections, with nearly two-thirds of Americans citing gas prices as a major problem in their daily lives.
The intersection of global geopolitical instability and local tax policy has created a tiered system of energy affordability. For those in the “high-spike” zones of the Midwest, the financial impact is no longer a marginal inconvenience but a significant hit to household discretionary spending.